Excel Alternative: Want More Capable Data Analytics Software Used By GE, For Free?
Excel Alternative — Garmin Smartwatch & Weight Scale Data Joined With Google Location Data
Sure, Microsoft Excel is perfect for entering data in rows and columns. But what if you want to quickly find practical meaning in your data that allows you to take action and make better data-driven decisions? For example, what if you wanted to learn how many steps you should take to sleep better tonight based on your smartwatch data history?
I’ve been helping companies and organizations find meaning in their data throughout my career, and I recently wanted more value out of my Garmin smartwatch and weight scale data. And I didn't want to write a single line of code.
I quickly ran into roadblocks and discovered a much more powerful alternative to Excel that hopefully will help you too! Large companies like GE, Cisco, Morgan Stanley, and Levi's pay for their employees to use this powerful alternative to Excel. Surprisingly, this same tool is full-featured and 100% free for individual users like you!
The best way to reveal this little-known secret is to walk you through my data analytics project so you can determine whether you've had similar challenges and objectives and whether this solution can work for you too. Here's what you need to know:
Data Analytics Project Background
Data Analytics Project Approach
Excel Alternative Revealed
Data Analytics Project Background
I was frustrated that the Garmin smartwatches I’ve been wearing for ten years could only give me charts on individual metrics. It only shows me, for instance, how my weight, step count, sleep, stress, or resting heart rate changes over time.
Garmin Steps & Weight Charts
While this has helped me, I wanted something more useful. I wanted to learn how all the metrics from my devices were related, if at all. If so, I would like to identify which metrics I could change to improve other metrics tied to my goals, like reducing stress and improving sleep quality.
To get started, I needed data. I asked Garmin for my data, and they sent me a folder of 246MB with no less than 1117 files in JSON format. If you're unfamiliar with JSON, it's simply a text file with data stored in 'keys' and 'values' vs. a spreadsheet with rows and columns. This is what two nights of sleep data from a Garmin JSON file looks like when you open it up in a text editor:
Sleep Data From Garmin JSON File
As is, this isn’t very useful. The parts left of the colon (keys) appear the same each day, while the pieces on the right side (values) seem to change daily. This data would be easier to work with if each key was a column in a familiar spreadsheet and the corresponding value was in a row under this column.
If I could reshape this data into multiple columns with one row per day, I could add additional columns with metrics from the other files, like the number of daily steps corresponding to each day.
If I could do this, I might get closer to understanding how all these different factors relate to each other daily and what I can do tomorrow to change any of them to improve the aspects tied to my goals, like lower stress for better heart health.
I also requested and downloaded my Google location data because I thought it might be possible that travel impacted my health stats. Google provided me with over 2GB of location data in JSON files.
Data Analytics Project Approach
For my project, I needed analytics software that made it easy to:
Load Data — Load and convert JSON data into rows and columns
Prepare Data — Prepare data so that each date has precisely one unique row, regardless of how many measurements of the same kind my devices took that day. For instance, if I took multiple body weight measurements one day, I would need to combine those into one by taking an average, or perhaps the first measurement of the day
Join Data — Combine all data sets into one table with rows and columns
Load Data
Excel is excellent for working with Excel or CSV files. But what if you want to work with data in a different format, like JSON? I tried to load my JSON files in Excel. Here's what that looked like:
Open JSON With Excel
Excel prompted me to answer a bunch of questions when I tried to open the file. I still struggled and failed to open it and convert the data into rows and columns. I needed an alternative to excel.
I thought about dusting off my coding skills to write a program in Python to read each line of the file and send each piece of data into an appropriate cell in a spreadsheet. While that approach would undoubtedly do the job, it seemed like too much work.
I looked to the world of business analytics tools for a modern excel alternative to make my life easier. I wanted analytics software I could download and use for free. I also wanted visual tools to help me work faster than writing code. I found two analytics tools that met these requirements. I downloaded and installed them both. I promise I'll share these with you soon!
One of them was more intuitive and easy to use, so I chose it for the rest of my project. Once I installed and launched the software, it prompted me to create a new project. Then it nudged me to upload my first data set.
Excel Alternative — Select File
I dragged my sleep data JSON file onto the analytics software, and like pure magic, this is what I saw next:
Excel Alternative — File Preview
To my sheer delight, it seemed like the application read my mind and guessed that I might want this JSON file structured in rows and columns! It asked me nothing, and I gave it no instructions! It showed me this data preview and prompted me to Create a new version of this file formatted in rows and columns! I needed this exact format, so I hit “Create”! This screen is what I saw next:
Excel Alternative — Create File
Eureka! The software instantly converted my data into beautiful rows and columns that I could understand and gave me a ton of helpful information about the data. For instance, it told me which columns lacked much data and would probably not be very useful, like "sleepResultType.” It also understood various data types, like dates in date columns.
I repeated this process to load the other files from Garmin with interesting data columns tracked for each day. Next, I had to prepare the data in each file so that there was no more or less than one row for each calendar date since I began using my devices. Each file should have the same number of rows — one for each day. Once all the files shared this similar format, I could combine them into one spreadsheet I could analyze. In data science terminology, this is 'time series' data.
You could follow a similar process to find insight within other time series data like stock price, monthly subscribers, or weather (to name a few), as they change over time.
Prepare Data
Excel Alternative — Prepare Data
To prepare each data set without writing code, I used a feature in the analytics software called 'Prepare'. In the Prepare screen, the software presented me with many options to manipulate my data.
Excel Alternative — Data Processors
For each data set, I deleted mostly empty columns. I also deleted columns that stored information unlikely to help my analysis, like my Garmin User ID. In addition to other standard data cleansing steps, I had to format the date column in each file to a standard format so that it looked identical in each file. An option in the Prepare feature made this process extremely simple and fast.
Excel Alternative — Parse Date
Before combining the data from all files into one spreadsheet, I had to ensure that there was one row for every calendar date in each file. There were missing rows for days when my devices didn't capture any data. I had to fill in those missing dates and the data missing for each column for those dates. Fortunately, a time series plugin for the software makes this step a breeze.
Excel Alternative — Time Series Data Resampling
I completed this transformation for each file. Along the way, I noticed that the analytics software automatically tracked every action I took on the data. I could quickly delete any action I took and revert to a previous data version. In addition, the software also automatically created a beautiful graphic of the work I had done, in order, from left to right. Because of this feature, I could easily explain my work to others and remind myself of what I had done. Finally, my data files were ready to be combined for analysis.
Excel Alternative — Prepared Data
Join Data
Excel Alternative — Join Data
I used the 'Join' visual recipe for this task. This feature prompted me to specify the identical date columns from each file and select which type of join I wanted. I went with a simple left join.
Excel Alternative — Join Data
I hit the RUN button, and voila! The software combined all my data sets! Finally, I had one spreadsheet with one row per day and one column for every metric my devices had tracked!
Excel Alternative — Joined File
At last, it was time for the fun part to see if I could learn anything new from my data. I could download the prepared and joined data set as a single Excel file (or another file format) if I wanted to use another tool to build charts and analyze the data.
Excel Alternative — Export Joined File
Instead, I continued with this application to glean insights from my data.
Excel Alternative Revealed
Even after removing over 100 columns from the original Garmin files, I still had 18 columns in the joined file. It seemed daunting to discover how any of these columns might be related. I had so many questions. For instance, was the time I went to bed related to the amount of stress I felt the next day? Or was the number of steps more closely associated with stress levels?
If I spent days building charts, perhaps I could begin to spot trends that gave me helpful information about how to optimize my health. If only there were a shortcut. Luckily, this software is a complete modern data science platform that includes AI/machine learning capabilities. I tried the 'AutoML' option to try and make sense of things.
Excel Alternative — AutoML Prediction
The software asked me to select a data 'feature' or column to create a prediction model. The AutoML will automatically build models for any data feature I choose to identify which of the other features, or columns, are most closely related. I selected 'totalAvgStress' for this example and hit the Create button.
Excel Alternative — Create AutoML Prediction Model on Total Average Stress
In less than a minute, a Random Forest machine learning model presented me with the variables most closely related to my stress levels on any given day!
Excel Alternative — AutoML: Predict Total Average Stress
If I trust this model, this analysis is compelling and valuable! Upon reflection, these results make sense! I feel calmer and relaxed when I get a good night's sleep and exercise. A state of being my heart will surely appreciate! To quickly validate the relationship between sleep and stress, I used the chart feature to plot stress over time according to hours of sleep in mere seconds.
Excel Alternative — Average Stress Over Time
Without any fine-tuning, this chart seems to agree with the machine learning model that I should expect to feel more stress on days when I sleep less (blue bars in the chart).
I could repeat this process for any other target variable I wanted to optimize. If I know what I'm doing, I can also make all kinds of tweaks and adjustments to improve the accuracy of the models.
Excel Alternative — Optimize Machine Learning Model
So how did I go from over 100 messy JSON files to a helpful reminder, powered by machine learning on my data, to sleep and exercise to lower stress without writing a single line of code?
Data Science Studio software by Dataiku is the analytics software that made this project possible! Without Dataiku, I might still be watching countless YouTube videos about complicated Excel formulas or buried in Python code. If you're looking for a more powerful alternative to excel to analyze your data, do yourself a favor and download the Free Edition of Dataiku for your operating system today!

[Full disclosure: I have not received compensation from any vendor for this article. I was a Dataiku employee from 2017 to 2020 on behalf of large enterprise customers. All thoughts are my own.]
For this project, the only other 100% free data science platform I could find (for individual users) was the Knime Analytics Platform.
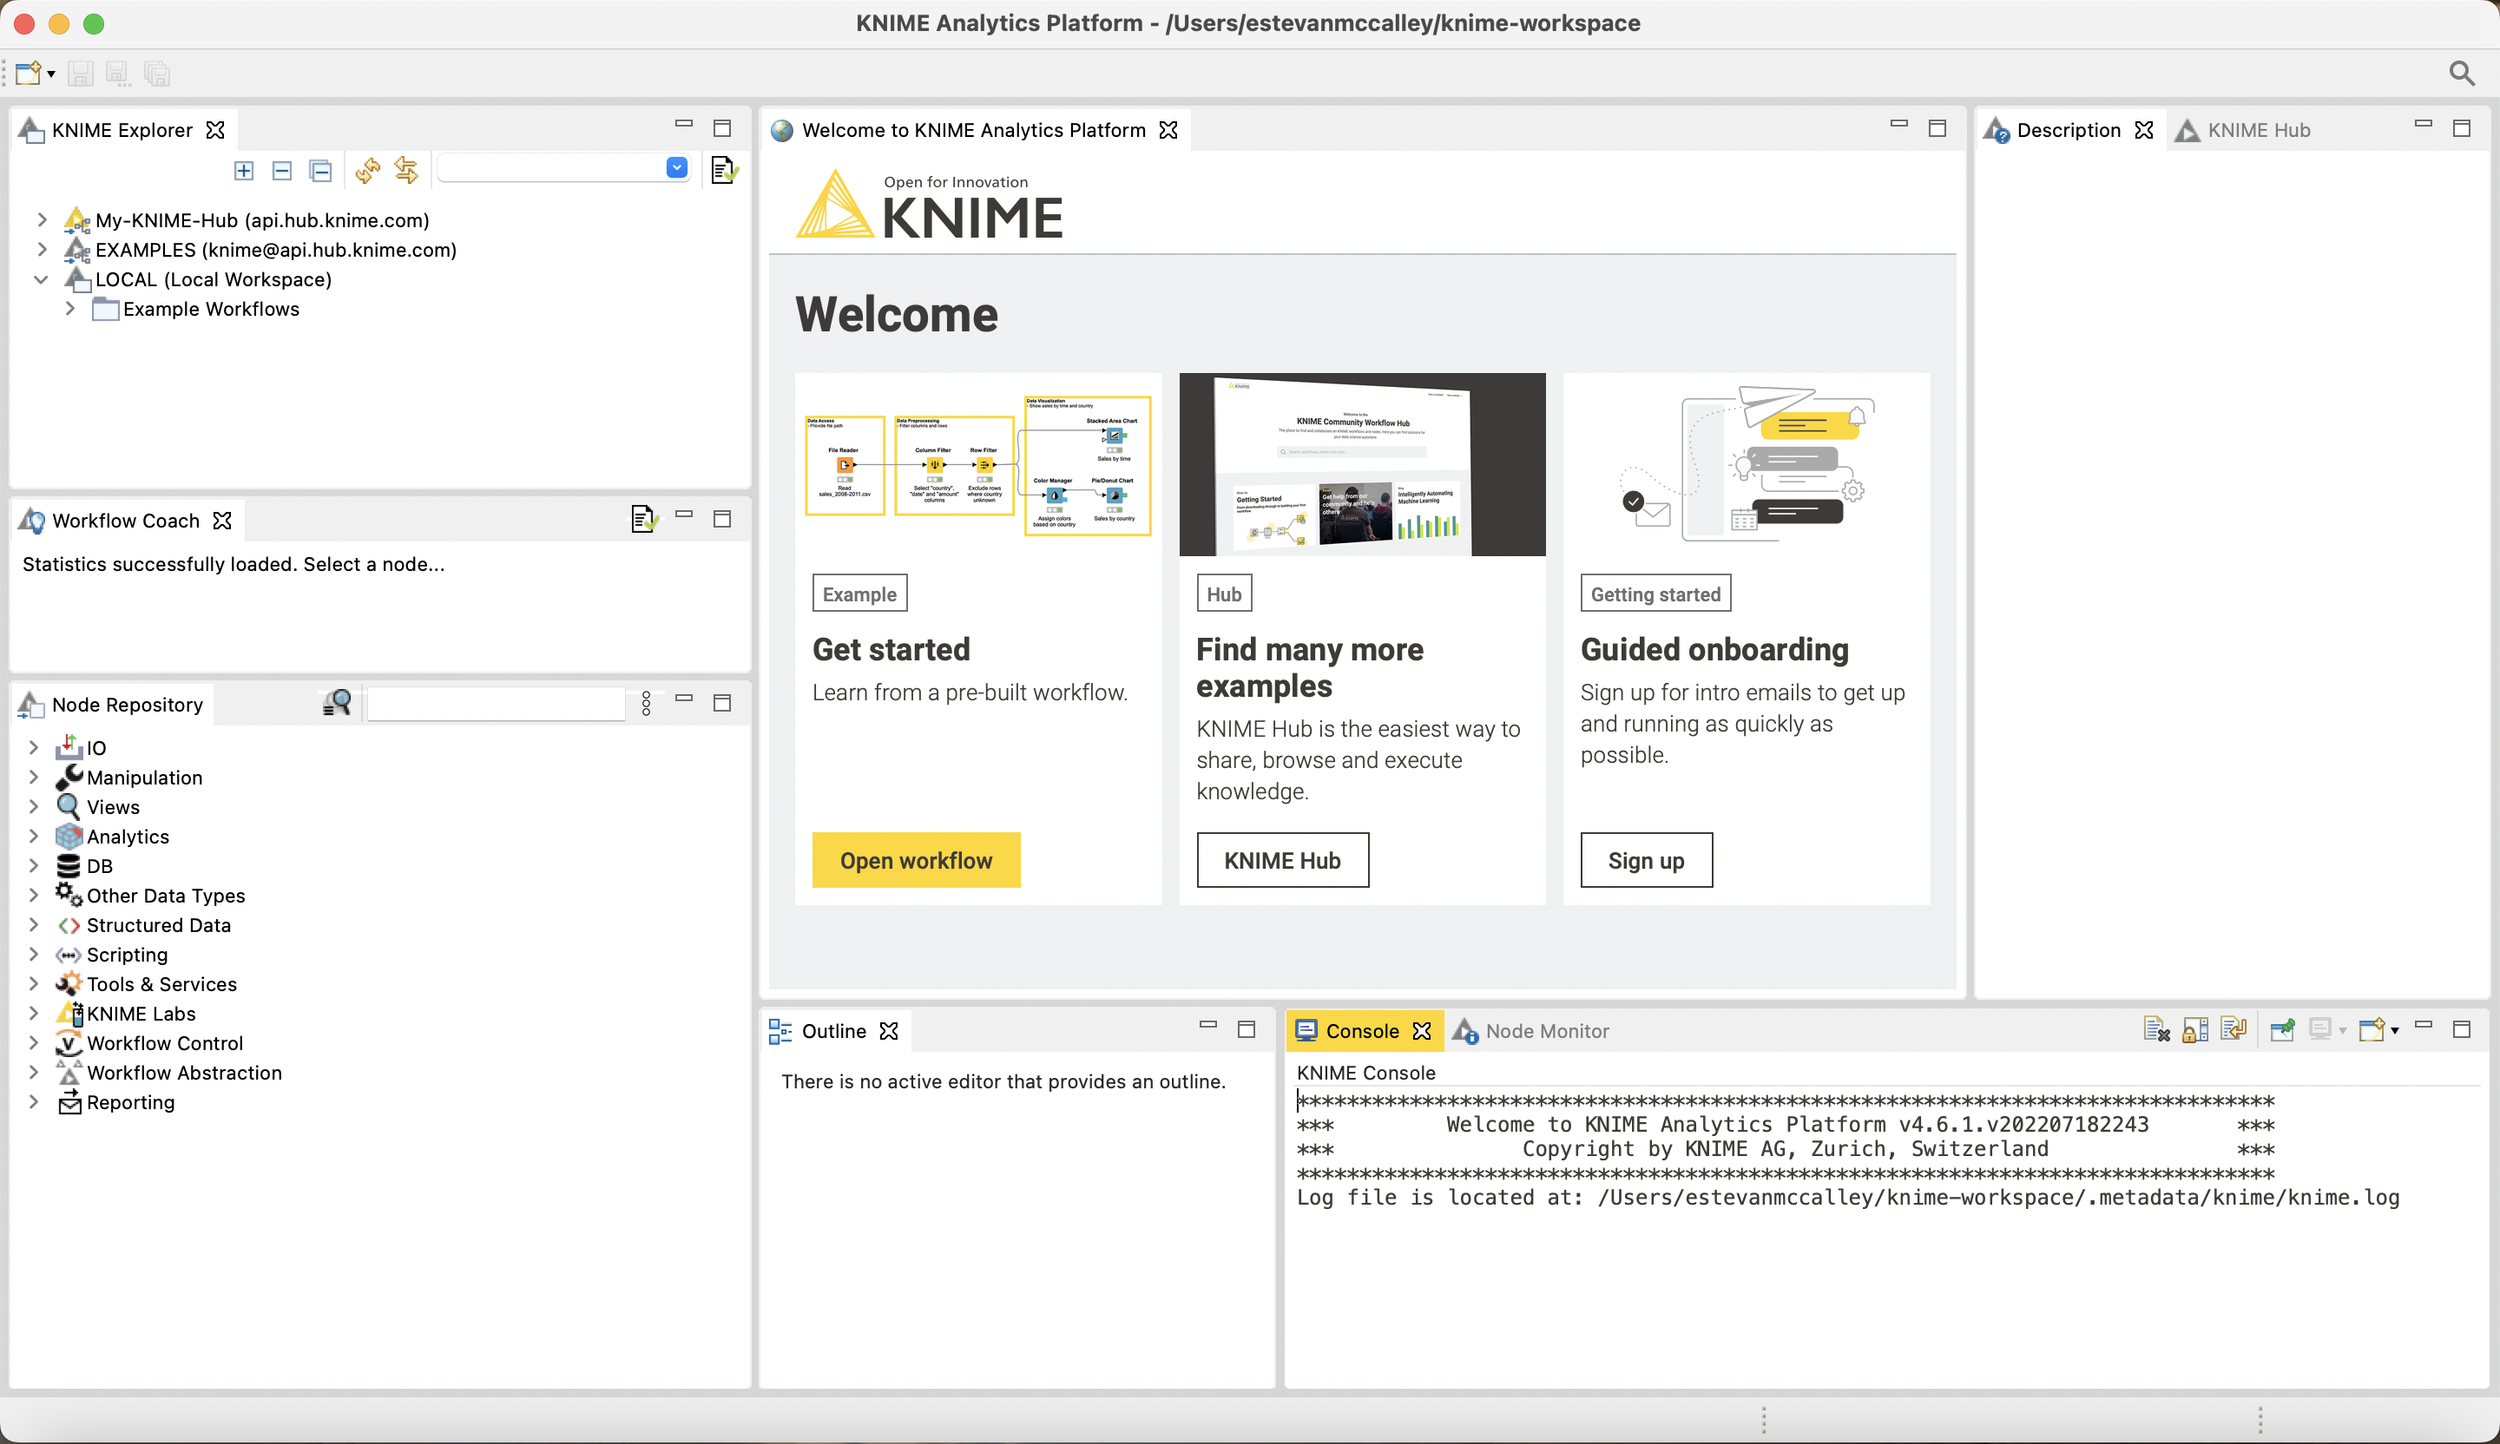
Others, like Alteryx, only provided limited free trials. For my taste, the Knime user interface looked more complicated than Dataiku, and I wasn’t quite sure what to do next. For others, Knime may be the perfect solution! Please let me know whether you agree, disagree, or know of a better Excel alternative for analytics! I would love to hear from you!

Subscribe to our Weekly Data & AI Newsletter
Stay ahead of the curve with data science & machine learning Insights, resources, and tips
Subscribe to our weekly Data Science & Machine Learning Technology Newsletter
Recent Posts
Posts by Category
- AI Governance 2
- AWS Generative AI 2
- Agentic AI 2
- ChatGPT Use Cases 3
- Conferences 1
- Data Science & Machine Learning Market Analysis 5
- Data Science & Machine Learning Operations 5
- Data Science & Machine Learning Platforms 14
- Generative AI 6
- Generative AI Example 2
- LLM Strategy 5
- LLM for Business 5
- Machine Learning Videos 2
- Microsoft Copilot 3